Google
 

Friday, January 17, 2025

Managing Logical Environments in AWS CDK: Using Qualifiers to Avoid Conflicts

Infrastructure as Code or IaC is an essential tool in modern DevOps. If you're working with AWS as your primary cloud provider, you're very likely working with one of the two tools AWS offers for IaC: CloudFormation or CDK.

While CDK provides some extra capabilities compared to CloudFormation, it requires some infrastructure to already exist in order to perform certain functionality. This infrastructure was optional in CDK v1 but is mandatory in CDK 2 to provision any stacks. The process of creating these infrastructure components is called bootstrapping.

Assuming that you have CDK tooling already set up on your machine, it's relatively easy to perform the bootstrapping process:

cdk bootstrap aws://{account-id}/{region}
cdk bootstrap aws://123456789012/ap-southeast-2

By default, this will create a stack with the name CDKToolkit:


 This stack include some resource like an ECR repository and S3 bucket:


As shown in the screenshots, the resources include a default qualifier "hnb659fds", which aside of being a random ugly string, this default is challenging when we have multiple logical environments like dev and test in the same AWS account because we'll have to use the same resources to serve these logical environments.

If it's required to separate these environments and have two different sets of CDK resources, we need to distinguish between these environments by specifying a qualifier. At the same time, we need to ensure that stack names don't conflict.

To achieve this, CDK CLI provides two parameters:

  1. --qualifier: replaces the default "hnb659fds" string in resource names.
  2. --toolkit-stack-name: overrides the default stack name.

For example, to bootstrap two separate logical environments, we can use:

cdk bootstrap aws://123456789012/ap-southeast-2 --qualifier dev --toolkit-stack-name CDKToolkit-dev
cdk bootstrap aws://123456789012/ap-southeast-2 --qualifier test --toolkit-stack-name CDKToolkit-test

This results in creating stacks and resources as shown:


The next question is: How to target a specific bootstrap qualifier when you deploy?
One way is to update cdk.json configuration file to set the bootstrap identifier:

cdk.json
"context": {
    "@aws-cdk/core:bootstrapQualifier": "test"
  }

If you prefer to set this value dynamically, for example to pass the environment name in a CI pipeline as an environment variable, you can use code instead: (This example uses C#)

var qualifier = Environment.GetEnvironmentVariable("CDK_QUALIFIER");
var synthesizer = new DefaultStackSynthesizer(new DefaultStackSynthesizerProps() { Qualifier = qualifier });
var stack = new Stack(app, "my-stack", new StackProps() { Synthesizer = synthesizer });

This method allows you to set up multiple environments within a single AWS account, enabling the application of distinct policies to CDK assets for logical divisions like dev and test or for separate teams sharing the account.


Saturday, September 7, 2024

Unlocking the Power of LLMs Locally with Docker Compose

Although the expectations that came with the advent of Large Language Models (LLMs) could be largely exaggerated, they still have proven to be useful in many scenarios and for a very wide audience. Probably, this is the closest non-technical users have come to interact with AI since its inception. ChatGPT has set the record for the fastest-growing user base.

Being an online tool, it comes with some concerns over privacy, customizability, and the constant need for an internet connection.
However ChatGPT is not the only player in this game. Many models are available online and for offline download. The latter is the focus of this post.

Recently, Meta release its latest model Llama 3.1. And I wanted to give it a try on my laptop, after positive feedback about it.

So, the objective I had was:

  • Find and easy way to setup the tooling required to download LLMs and get responses to my prompts locally.
  • Have a nice user interface that I can use to give prompts, save prompt history, and customize my environment.

 Two tools play very well together:

Ollama: https://ollama.com/
Think of Ollama as the npm or pip for language models. It enables you to download models, execute prompts from the CLI, list models and so on. It also provides APIs that can be called from other applications. These APIs are compatible with OpenAI Chat Completions API.

Open WebUI: https://openwebui.com/
Self-hosted web interface, very similar to what you get from OpenAI's ChatGPT web interface. Open WebUI can interface with Ollama. Think about it as a front end for the backend provided by Ollama.


Since I prefer to use Docker whenever possible to experiment with new tools, I opted to use it instead of installing any tools locally. Especially that I'm almost a complete beginner to this space.

Open WebUI provides docker images that include both Open WebUI and Ollama in the same image! Which makes setting up the whole stack locally super easy.

The documentation provides this example command to run the container:

docker run -d -p 3000:8080 --gpus=all -v ollama:/root/.ollama -v open-webui:/app/backend/data --name open-webui --restart always ghcr.io/open-webui/open-webui:ollama
This command does the following:
  1. Starts the container, from the image ghcr.io/open-webui/open-webui:ollama. The --restart always parameter restarts the container automatically if it fails or was stopped.
  2. Maps the local port 3000 to Open WebUI port 8080.
  3. Maps docker volumes to paths within the container. This persists data even if the container is deleted. This is important to persist history and downloaded models, which are big.

I prefer to use docker compose, additionally I wanted to have the easy visibility on the data created by Open WebUI and the models downloaded by Ollama, so I chose to bind folders on my local machine instead of using volumes. Here is how the docker-compose.yml looks like:

services:
  OpenWebUI:
    image: ghcr.io/open-webui/open-webui:ollama
    container_name: open-webui
    environment:
      - WEBUI_AUTH=False
    volumes:
      - C:\open-webui:/app/backend/data
      - C:\ollama:/root/.ollama
    ports:
      - 3000:8080
    deploy:
      resources:
        reservations:
          devices:
            - driver: nvidia
              count: all
              capabilities: [gpu]

Starting the stack is easy:

docker compose up -d

It may take a short while before it's ready, If you check the container logs (I use Docker Desktop on windows) you should see something similar to:


Then you can open your browser on http://localhost:3000/ and start playing.

Downloading models

Remember that this docker image does not include any models yet so probably the first step is to click the plus icon beside the "Select a model" label and write a model name. You'll find a list of model names in https://ollama.com/library. Click a model name, and choose the model size and the model name will be shown. So to download the 8b (8 billion parameters version) of llama3.1, write llama3.1:8b in the Open WebUI interface.

As shown in the screenshot below, I downloaded llama3.1:8b, gemma2:2b (Google's lightweight model). Note that the larger the number of parameters, the higher the specs your computer needs to have.

Testing with some prompts

After downloading models, you can try some prompts:


Note that you can interact with ollama CLI directly. Either use docker compose exec OpenWebUI bash or use docker desktop:


Now if you want to stop the container, run docker compose down

A note on GPUs

Ollama can run models using GPU, or CPU only. As you see in the docker compose file, I'm specifying that the container can use all the available GPUs on my machine. If you're using Docker desktop with WSL support, ensure that you have the latest WSL and Nvidia drivers installed. You can use this command to test that docker GPU access is working fine:

docker run --rm -it --gpus=all nvcr.io/nvidia/k8s/cuda-sample:nbody nbody -gpu -benchmark


Closing notes:

It's very exciting to have an LLM running locally. It opens a lot of customization possibilities and keeps your data private.
The machine I tried this experiment on is relatively old, so gemma2:2b was much faster than llama3.1:7b and still performed very well.
Looking forward to experiment more!

Note: The title of this post was recommended by gemma2 :)


Saturday, June 8, 2024

The simplest data pipeline ever

As software engineers what we care most about is getting stuff done. The simplest approach is probably the best, as long as it doesn't cause long term issues.

I was working on a project where the creation and initialization of a few PostgreSQL databases required data migration and transformation from another set of databases. The first step in this process involved loading a few hundreds of millions of records from the source databases into the destination databases.
I wanted to implement this in a way that is fully automated, and at the same time, I wanted to simplify this process as much as possible. So, no fancy tools. No cloud infrastructure. No nothing. Is that even possible?

The approach we followed was simply using Linux pipes! Linux pipes can transfer data from one process to another. So how could this help with this data import process ?

Postgres provides useful command line utilities that can be used to export and import data. For example this command exports data from a table called mydata to the standard output:

psql -h source -U postgres -d test -c "\copy mydata TO STDOUT"

On the other hand you can import data from standard input to a database table using this command:

psql -h destination -U postgres -d test -c "\copy mydata FROM STDIN"

With the power of Linux pipelines it's possible to stitch these commands together so that the output of the first command feeds into the input of the next and data flows from one database to another.

psql -h source -U postgres -d test -c "\copy mydata TO STDOUT" | psql -h destination -U postgres -d test -c "\copy mydata FROM STDIN"

Pretty simple. Isn't it? However since this operation may take a few hours, wouldn't it be nice to have some sort of progress indication ?
This is where another handy Linux utility comes to play: The pv utility. From the man page:

pv - monitor the progress of data through a pipe

By default this tool shows the number of bytes flowing through the pipe, however in the process of data import, the number of imported records is a better representative of the progress of the operation. The good thing is that pv has switches that enable counting the number of lines instead of bytes. So the final solution would look like:

psql -h source -U postgres -d test -c "\copy mydata TO STDOUT" | \ 
pv --line-mode --size 100000000 | \ 
psql -h destination -U postgres -d test -c "\copy mydata FROM STDIN"

Note that the --size parameter assumes knowledge of the total number of records, which can be retrieved using a simple select count(*), or just omitted.

When I run this in terminal, the progress looks like:


Transferring 100m records from one database to another both running as containers on my local machine took about 8 minutes. In case of transferring data over the network, it's expected to be slower.


Needless to say that in the real life implementation other steps were required like retrieving the credentials for the source and destination databases and hooking the scripts into a CI pipeline.

Surely, this isn't the most efficient way to transfer a lot of data. Note that the data is transferred as text which is far less efficient than the binary transfer that proper data import tools would use. As with any decision we make as software engineers it's all about tradeoffs. My priorities were clear: We need the simplest possible repeatable solution.

If you're interested in trying this on your machine, this is how I prepared the above screenshots:
Let's start with a docker compose file which instantiates 3 containers:

  1. A source database
  2. A destination database
  3. And a client where there data import / export process is executed.
version: "3.8"

networks:
  db-network:
    driver: bridge

services:
  source:
    image: postgres:16.1
    environment:
      - POSTGRES_PASSWORD=MYPASS123
    volumes:
      - type: volume
        source: source-data
        target: /var/lib/postgresql/data
    ports:
      - 9432:5432


  destination:
    image: postgres:16.1
    environment:
      - POSTGRES_PASSWORD=MYPASS123
    volumes:
      - type: volume
        source: destination-data
        target: /var/lib/postgresql/data
    ports:
      - 9433:5432

  client:
    container_name: postgres_client
    build: .
    entrypoint: [ "sleep", "infinity" ]


volumes:
  source-data:
    external: true
    name: source-data

  destination-data:
    external: true
    name: destination-data


Note that for the client container a Dockerfile is used and that is to ensure that the required utilities for this process -in particular pv- are installed. Additionally to copy the .pgpass file which contains the database passwords. 

FROM postgres:16.1

RUN apt-get update

RUN apt-get install pv

COPY pgpass /root/.pgpass

RUN chmod 0600 /root/.pgpass

source:5432:test:postgres:MYPASS123
destination:5432:test:postgres:MYPASS123


Then start this docker compose stack using:

docker compose up -d --build

Connect to the databases using your favorite tool (mine is Azure data studio) and create the test table by executing this query:

CREATE TABLE public.mydata (
	id int NOT NULL,
    firstname varchar NULL,
	lastname varchar NULL,
	email varchar NULL,
	CONSTRAINT mydata_pk PRIMARY KEY (id)
);

The next step would be to populate some test data into the source database:

INSERT INTO public.mydata
(firstname, lastname, email, id)
select concat('firstname', counter), concat('lastname', counter), concat('firstname', counter, '.', 'lastname', counter, '@email.com'), counter
	from pg_catalog.generate_series(1, 100000000) as counter

Then connect to the client container using:

docker compose exec client bash

And execute the script to start the data migration:

psql -h source -U postgres -d test -c "\copy mydata TO STDOUT" | \ 
pv --line-mode --size 100000000 | \ 
psql -h destination -U postgres -d test -c "\copy mydata FROM STDIN"


I hope this helps.

Friday, February 16, 2024

Changing log level for .net apps on the fly

Logging is very important to understand the behavior of an application. Logs can be used to analyze application behavior over an extended time period to understand trends or anomalies, but they're also critical to diagnose issues in production environments when the application is not behaving as expected.

How much logs an application should emit is a matter of tradeoffs. Writing too much logs may negatively impact application performance and increase data transfer and storage costs without adding value. Too few logs makes it very difficult to troubleshoot issues. This is why most logging frameworks allow configuring log levels so that the application developers can add as much logging as needed, but only logs with a specific level or below will actually be written to the destination.

The challenge is that you don't need all the logs all the time. You certainly can redeploy or reconfigure the application and restart it to change the log level, but this would be a bit disruptive. The good thig is that .net configuration system allows updating configuration values on the fly. Consider this simple web API:


var builder = WebApplication.CreateBuilder(args);

builder.Logging.AddConsole();

var app = builder.Build();

app.MapGet("/numbers", () =>
{
    app.Logger.LogDebug("Debug");
    app.Logger.LogInformation("Info");
    app.Logger.LogWarning("Warning");
    app.Logger.LogError("Error");

    return Enumerable.Range(0, 10);
});

app.Run();

With logging configuration file:

{
  "Logging": {
    "LogLevel": {
      "Default": "Error",
      "Microsoft.AspNetCore": "Warning"
    }
  }
}
When the /numbers endpoint is called, these logs are written to the console:
fail: ConfigReload[0]
      Error

This is clearly because the configured default log level is "Error". You can add a simple endpoint that changes the log level on the fly, like this:


app.MapGet("/config", (string level) => 
{
    if (app.Services.GetRequiredService<IConfiguration>() is not IConfigurationRoot configRoot)
        return;

    configRoot["Logging:LogLevel:Default"] = level;
    configRoot.Reload();
});

When you issue the GET request /config?level=Information Then invoke the /numbers endpoint again, the log output will look like:

info: ConfigReload[0]
      Info
warn: ConfigReload[0]
      Warning
fail: ConfigReload[0]
      Error

Similarly, to configure the log level to Debug, invoke /config?level=Debug. Very simple.

There are a few gotchas to consider:

  1. This the /config endpoint should be secured, only a privileged user should be able to invoke it as it changes the application behavior. I've intentionally ignored this in my example for simplicity.
  2. In case there are many instances serving the same API the /config invocation will be directed by the load balancer to only one instance of your application which most probably won't be sufficient. In this case you will need another approach to communicate with your application that the log level should be modified. One approach could be a pub-sub system that allows multiple consumers. This may be a subject of another blog post.

Another common approach for reconfiguring.net applications on the fly is by using a configuration source that refreshes automatically every specific time interval or based on config file change detection.
However the time based approach means that you have to wait until a certain time elapses for the application to reconfigure itself which may not be desirable as you want to change the log level as quickly as possible. A file change detection approach is not great for immutable deployments like container based applications or serverless functions.

Logging and monitoring are quality attributes that should be taken into consideration during the application design. In case you're not using a more advanced observability tooling that allow profiling for example then the technique proposed in this blog post may be of help.

Friday, January 12, 2024

Assertions of Equality and Equivalence

I remember that I encountered an interesting bug that was not detected by unit tests because the behaviour of the test framework did not match my expectations.
The test was supposed to verify that the contents of an array (or a list) returned by the code under test match an expected array of elements in the specific order of that expected array. The unit test was passing, however, later the team discovered a bug, and the root cause was that the array was not in the correct order! This is exactly why we write automated tests, but the test failed us.

The test, which uses FluentAssertions library basically looked like:

[Test]
public void FluentAssertions_Unordered_Pass()
{
	var actual = new List<int>  {1, 2, 3}; // SUT invocation here
	var expected = new [] {3, 2, 1};

	actual.Should().BeEquivalentTo(expected);
}
Although the order of the elements of the actual array don't match the expected, the test passes. This is not a bug in FluentAssertions. It's by design, and the solution is simple:
actual.Should().BeEquivalentTo(expected, config => config.WithStrictOrdering());


The config parameter enforces a specific order of the collection. It's also possible to configure this globally, when initializing the test assembly for example:

AssertionOptions.AssertEquivalencyUsing(config => config.WithStrictOrdering());


The default behavior of this method annoyed me. In my opinion, the test method should be strict by default. That is, it should assume that the collection should be sorted, and can be made more lenient by overriding this behavior. Not the opposite.

Probably I got into the habit of using BeEquivalentTo(), while an Equal() assertion exists, which "Expects the current collection to contain all the same elements in the same order" as it's default behavior. There are other differences between BeEquivalentTo() and Equal() that don't matter in this context. 

Similar behavior applies to Nunit assertions, although there is no way to override the equivalence behavior:

[Test]
public void NUnit_Unordered_Pass()
{
	var actual = new [] {1, 2, 3};
	var expected = List<int>  {3, 2, 1};

	Assert.That(actual, Is.EquivalentTo(expected)); // pass
	CollectionAssert.AreEquivalent(expected, actual); // pass
}
[Test]
public void NUnit_Unordered_Fail()
{
	var actual = new [] {1, 2, 3};
	var expected = new List<int> {3, 2, 1};

	Assert.That(actual, Is.EqualTo(expected)); // fail
	CollectionAssert.AreEqual(expected, actual); // fail
}


It's important to understand the behavior of the testing library to avoid similar mistakes. We rely on tests as our safetly net, and they better be reliable!

Friday, September 22, 2023

Handling special content with Handlebars.net Helpers

Generating formatted reports based on application data is a very common need. For example, you may want to create an HTML page with content from a receipt. This content may be sent in an HTML formatted email or converted to PDF or any other use case. To achieve this, a flexible and capable templating engine is needed to transform the application data to a human readable format.
.net has a very powerful templating engine that's used in its asp.net web framework which is Razor templates. But what if you want to use a templating engine that is simpler, and doesn't require a web stack as in the case of building background jobs, desktop or mobile applications?


Handlebars.net is a .net implementation of the famous HandlebarsJS templating framework. From Handlebars.net Github repository:

"Handlebars.Net doesn't use a scripting engine to run a Javascript library - it compiles Handlebars templates directly to IL bytecode. It also mimics the JS library's API as closely as possible."
For example: consider this collection of data that should be rendered as an HTML table:

var employees = new [] 
{
    new Employee
    {
        BirthDate= DateTime.Now.AddYears(-20),
        Name = "John Smith",
        Photo = new Uri("https://upload.wikimedia.org/wikipedia/commons/thumb/2/29/Houghton_STC_22790_-_Generall_Historie_of_Virginia%2C_New_England%2C_and_the_Summer_Isles%2C_John_Smith.jpg/800px-Houghton_STC_22790_-_Generall_Historie_of_Virginia%2C_New_England%2C_and_the_Summer_Isles%2C_John_Smith.jpg")
    },
    new Employee
    {
        BirthDate= DateTime.Now.AddYears(-25),
        Name = "Jack",
        Photo = new Uri("https://upload.wikimedia.org/wikipedia/commons/e/ec/Jack_Nicholson_2001.jpg")
    },
    new Employee
    {
        BirthDate= DateTime.Now.AddYears(-40),
        Name = "Iron Man",
        Photo = new Uri("https://upload.wikimedia.org/wikipedia/en/4/47/Iron_Man_%28circa_2018%29.png")
    },
};

A Handlebars template may look like:

<html>
<body>
	<table border="1">
		<thead>
			<tr>
				<th>Name</th>
				<th>Age</th>
				<th>Photo</th>
			</tr>
		</thead>
		<tbody>
			{{#each this}}
			<tr>
				<td>{{Name}}</td>
				<td>{{BirthDate}}</td>
			</tr>
			{{/each}}
		</tbody>
	</table>

</body>
</html>

The template is fairly simple. Explaining the syntax of Handlebars templates is beyond the scope of this article. Check Handlebarjs Language Guide for information regarding its syntax.

Passing the data to the Hanledbar.net and render the template is easy:

var template = File.ReadAllText("List.handlebars");
var compiledTemplate = Handlebars.Compile(template);
var output = compiledTemplate(employees);

Console.WriteLine(output);

Line 1 reads the List.handlebars template which is stored in the same application folder, alternatively the template can be stored as an embedded resource or retrieved from a database or even created on the fly.
Line 2 compiles the template, generating a function that can be invoked later. 

Note: For good performance, the compiled template should be generated once and used multiple times during the lifetime of the application.

Line 3 invokes the function passing the employees collection and receives the rendered output in a string variable.

This is the generated HTML:

<html>
<body>
	<table border="1">
		<thead>
			<tr>
				<th>Name</th>
				<th>Age</th>
				<th>Photo</th>
			</tr>
		</thead>
		<tbody>
			<tr>
				<td>John Smith</td>
				<td>2003-09-09T22:08:23.3541971+10:00</td>
				<td><img src="https://upload.wikimedia.org/wikipedia/commons/thumb/2/29/Houghton_STC_22790_-_Generall_Historie_of_Virginia%2C_New_England%2C_and_the_Summer_Isles%2C_John_Smith.jpg/800px-Houghton_STC_22790_-_Generall_Historie_of_Virginia%2C_New_England%2C_and_the_Summer_Isles%2C_John_Smith.jpg" width="200px" height="200px" /></td>
			</tr>
			<tr>
				<td>Jack</td>
				<td>1998-09-09T22:08:23.3839317+10:00</td>
				<td><img src="https://upload.wikimedia.org/wikipedia/commons/e/ec/Jack_Nicholson_2001.jpg" width="200px" height="200px" /></td>
			</tr>
			<tr>
				<td>Iron Man</td>
				<td>1983-09-09T22:08:23.3839479+10:00</td>
				<td><img src="https://upload.wikimedia.org/wikipedia/en/4/47/Iron_Man_%28circa_2018%29.png" width="200px" height="200px" /></td>
			</tr>
		</tbody>
	</table>

</body>
</html>

And this is how the output is rendered by a browser:


Putting aside lack of styling which has nothing to do with Handlebars, the output seems good but suffers for two issues:

  1. The format of the Age property is not great.
  2. The image tags rendered by the template reference the full URL of the images. Every time the generated HTML is consumed and rendered, it will have to fetch the images from their sources, which may be inconvenient. Additionally, the generated template is not self-contained, and other services that consume the generated HTML (like an HTML to PDF conversion service) will have to download the images.

Although the Handlebars has a powerful templating language, it's impossible to cover all needs that may arise, this is why Handlebars.net provides the ability to define custom helpers.
 

Custom Helpers: 

Helpers provide an extensibility mechanism to customize the rendered output. Once created and registered with Handlebars.net, they can be invoked from templates as if they were part of Handlebar's templating language.
Let's use helpers to solve the date format issue:
Handlebars.RegisterHelper("formatDate", (output, context, arguments)
                => { output.Write(((DateTime)arguments[0]).ToString(arguments[1].ToString())); });

This one-line registers a formatDate helper that takes the first argument and formats it using the second argument. To call this helper in the template:

<td>{{formatDate BirthDate "dd/MM/yyyy"}}</td>

The rendered output is much better now:


Embedding images in the HTML output

To solve the second issue mentioned above, we can write a custom helper to embed image content using the data URI scheme.
This is a basic implementation of this "embeddedImage" helper:

Handlebars.RegisterHelper("embeddedImage", (output, context, arguments) =>
{
    var url = arguments[0] as Uri;
    using var httpClient = new HttpClient();

    // add user-agent header required by Wikipedia. You should safely ommit the following line for other sources
    httpClient.DefaultRequestHeaders.UserAgent.Add(new ProductInfoHeaderValue("example.com-bot", "1.0"));

    var content = httpClient.GetByteArrayAsync(url).Result;
    var encodedContent = Convert.ToBase64String(content);
    output.Write("data:image/png;base64," + encodedContent);
});

The code uses an HttpClient to download the image as a byte array, then encode it using base64 encoding, then writes the output as a data URI using the standards format. And the usage is very simple:

<img width="200px" height="200px" src="{{embeddedImage Photo}}"  />

And the HTML output looks like: (trimmed for brevity)

<img width="200px" height="200px" src="data:image/png;base64,/9j/4gIcSUNDX1BST0ZJTEUAAQEAAAIMbGNtcwIQAABtbnRyUkdCIFhZWiAH3AABABkAAwApAD.....


Conclusion

One of the most important design principals is the Open-Closed Principal: software entities should be open for extension but closed for modification. Handlebars and Handlebars.net apply this principal by allowing users to extend the functionality of the library without having to modify its source code, which is a good design.
With a plethora of free and commercial libraries available for developers, the level of extensibility should be one of the evaluation criteria used during the selection process.
And you, what other templating libraries have you used in .net applications? How extensible are these libraries?

Friday, June 30, 2023

Mind games of measurements and estimates: Hidden meanings behind numbers and units


I'm a fan of science and nature documentaries. A few years ago, National Geographic Abu Dhabi was my favorite channel. It primarily featured original NatGeo content, which was dubbed in Arabic.
The content variety and interesting topics from construction, to wild life, air crash investigations and even UFO; provided me with a stream of knowledge and enjoyment. But in some times, also confusion!

One source of confusion was the highly accurate numbers used to describe things that normally could not be measured to that level of accuracy!
In one instance, a wild animal was described to have a weight reaching something like 952 kilograms. Not 900, not 1000 or even 950, but exactly 952.
In another instance, a man was describing a flying object, and he mentioned that the altitude of that object was 91 meters. That man must have laser distance meters in his eyes!

When I thought about this, I figured out that probably while translating these episodes, units of measurements were converted from pounds to kilograms, from feet and yards to meters, and from miles to kilometers, and so on. This is because the metric system is used in the Arab world and is more understandable by the audience.
Converting the above numbers back to the original units made them sound more logical. The wild animal weighed approximately 2200 pounds, and the man was describing an object flying about 100 yards or 300 feet high. That made much more sense.

But why did these round figure numbers seem more logical and more acceptable when talking about things that cannot be accurately measured? After all, 2200 pound are equal to 952 kilograms, and 100 yards are 91.44 meters. Right?

Apparently, the way we perceive numbers in casual conversations implicitly associates an accuracy level.
This Wikipedia note gives an example of this:
"Sometimes, the extra zeros are used for indicating the accuracy of a measurement. For example, "15.00 m" may indicate that the measurement error is less than one centimetre (0.01 m), while "15 m" may mean that the length is roughly fifteen metres and that the error may exceed 10 centimetres."

Similarly, smaller units can be used to give a deceiving indication of accuracy. A few years ago, I was working with a colleague on a high level estimates of a software project. We used weeks as our unit of estimate because -as expected- we knew very little about the project and we expressed this in terms of coarse-grained estimates.
From experience, we knew that this level of accuracy won't be welcome by who requested the estimates, and they may want to get more accurate ones. I laughingly told my colleague: "If they want the estimates in hours, they can multiply these numbers by 40!". I feel I was mean saying that. Of course the point was the accuracy, not the unit conversion.

One nice thing about using Fibonacci numbers in relative estimates, is that they detach the numeric estimates from any perceived accuracy. When the estimate is 13 story points, it's totally clear that the only reason why it's 13, - not 12 or 14  for example- is not because we believe it to be accurately 13. It's just because we don't have the other numbers on the estimation cards. It's simply a best guess.

Beware of the effects of units and numbers you use. They may communicate more than what you originally intended.

Wednesday, May 10, 2023

Setting exit code of a .net worker application

When building a .net worker application with a hosted service based on the BackgroundService class, it's some times it's required to set the application exit code based on the outcomes of the execution of the hosted service.

One trivial way to do this is to to set the Environment.ExitCode property from the hosted service:


public class Worker : BackgroundService
{
    public Worker()
    {

    }

    protected override async Task ExecuteAsync(CancellationToken stoppingToken)
    {
        try
        {
            throw new Exception("Something bad happened");
        }
        catch
        {
            Environment.ExitCode = 1;
        }
    }
}

This works, however consider these unit tests:


[Test]
public async Task Test1()
{
    Worker sut = new Worker();
    await sut.StartAsync(new CancellationToken());

    Assert.That(Environment.ExitCode, Is.EqualTo(1));
}

[Test]
public void Test2()
{
    // another test
    Assert.That(Environment.ExitCode, Is.EqualTo(0));
}

Test1 passes, however Test2 fails as Environment.ExitCode is a static variable. You can reset back to zero it after the test, but this is error-prone. So what is the alternative?

One simple solution is to use a status code-holding class as a singleton and inject it into the background service:


public interface IStatusHolder
{
    public int Status { get; set; }
}

public class StatusHolder : IStatusHolder
{
    public int Status { get; set; }
}

public class Worker : BackgroundService
{
    private readonly IStatusHolder _statusHolder;

    public Worker(IStatusHolder statusHolder)
    {
        _statusHolder = statusHolder;
    }

    protected override async Task ExecuteAsync(CancellationToken stoppingToken)
    {
        try
        {
            throw new Exception("Something bad happened");
        }
        catch
        {
            _statusHolder.Status = 1;
        }
    }
}

As simple Program.cs would look like:


using EnvironmentExit;

IHost host = Host.CreateDefaultBuilder(args)
    .ConfigureServices(services =>
    {
        services.AddHostedService<Worker>();
        services.AddSingleton<IStatusHolder, StatusHolder>();
    })
    .Build();

host.Start();

var statusHolder = host.Services.GetRequiredService<IStatusHolder>();
Environment.ExitCode = statusHolder.Status;

Note that line number 8 registers IStatusHolder as a singleton, which is important to maintain its state.

Now all tests pass. Additionally, when the application runs, the exit code is 1.

Friday, January 27, 2023

PowerShell core compatibility: A lesson learned the hard way

PowerShell core is my preferred scripting language. I've been excited about it since its early days. Here's a tweet from back in 2016 when PowerShell core was still in beta:


I've used PowerShell to automate build steps, deployments, and other tasks on both dev environments and CICD pipelines. It's great to write a script on my Windows machine, test it using PowerShell core, and run it on my docker Linux-based build environments with 100% compatibility. Or so I thought until I learned otherwise!

A few years ago, I was automating a process which required creating a folder if it didn't exist. Out of laziness, this is how I implemented this functionality: 

mkdir $folder -f

When the folder exists and the -f (or --Force) flag is passed, the command will return the existing directory object without errors. I know this is not the cleanest way -more on this later- but it works on my Windows machine, so it should also work in the docker Linux container, except that it didn't. When the script ran, it resulted in this error:

/bin/mkdir: invalid option -- 'f'
Try '/bin/mkdir --help' for more information.

Why did the behavior differ? It turns out that mkdir means different things depending on whether you're running PowerShell on Windows or Linux. And this can be observed using Get-Command Cmdlet:

# Windows:
Get-Command mkdir

The output is:

CommandType     Name                                               Version
-----------     ----                                               -------
Function        mkdir

Under Windows, mkdir is a function, and the definition of this function can be obtained using

(Get-Command mkdir).Definition

And the output is:

<#
.FORWARDHELPTARGETNAME New-Item
.FORWARDHELPCATEGORY Cmdlet
#>

[CmdletBinding(DefaultParameterSetName='pathSet',
    SupportsShouldProcess=$true,
    SupportsTransactions=$true,
    ConfirmImpact='Medium')]
    [OutputType([System.IO.DirectoryInfo])]
param(
    [Parameter(ParameterSetName='nameSet', Position=0, ValueFromPipelineByPropertyName=$true)]
    [Parameter(ParameterSetName='pathSet', Mandatory=$true, Position=0, ValueFromPipelineByPropertyName=$true)]
    [System.String[]]
    ${Path},

    [Parameter(ParameterSetName='nameSet', Mandatory=$true, ValueFromPipelineByPropertyName=$true)]
    [AllowNull()]
    [AllowEmptyString()]
    [System.String]
    ${Name},

    [Parameter(ValueFromPipeline=$true, ValueFromPipelineByPropertyName=$true)]
    [System.Object]
    ${Value},

    [Switch]
    ${Force},

    [Parameter(ValueFromPipelineByPropertyName=$true)]
    [System.Management.Automation.PSCredential]
    ${Credential}
)

begin {
    $wrappedCmd = $ExecutionContext.InvokeCommand.GetCommand('New-Item', [System.Management.Automation.CommandTypes]::Cmdlet)
    $scriptCmd = {& $wrappedCmd -Type Directory @PSBoundParameters }

    $steppablePipeline = $scriptCmd.GetSteppablePipeline()
    $steppablePipeline.Begin($PSCmdlet)
}

process {
    $steppablePipeline.Process($_)
}

end {
    $steppablePipeline.End()
}

Which as you can see, wraps the New-Item Cmdlet. However under Linux, it's a different story:

# Linux:
Get-Command mkdir

Output:

CommandType     Name                                               Version
-----------     ----                                               -------
Application     mkdir                                              0.0.0.0

It's an application, and the source of this applications can be retrieved as:

(Get-Command mkdir).Source
/bin/mkdir

Now that I know the problem, the solution is easy:

New-Item -ItemType Directory $folder -Force

It's generally recommended to use Cmdlets instead of aliases or any kind of shortcuts to improve readability and portability. Unfortunately PSScriptAnalyzer - which integrates well with VSCode- will highlight this issue in scripts but only for aliases (like ls) and not for functions. AvoidUsingCmdletAliases.

I learned my lesson. However, I did it the hard way.

Sunday, June 5, 2022

Reading a file from a Docker container in .net core

In many situations it might be needed to read files from a docker container using .net code.
Docker.DotNet library is very useful to interact with docker from .net. And it provides a useful method (GetArchiveFromContainerAsync) to read files from a docker container.
When I tried to use this method to read a small csv/text file, the file content looked weird a bit. It seemed like there was an encoding issue!

When I checked the code on Github, I found that the returned data is a tarball stream. Which makes sense as Docker documentation mentions that the returned stream is a Tar stream.

To read the Tar stream, I tried to use SharpZipLib library's TarInputStream class. However, that didn't work as apparently the library requires a seekable stream while the stream contained in the GetArchiveFromContainerResponse returned from the method is not.
The workaround -which works well for relatively small files- is to copy the stream to a memory stream and use that instead.

This is a sample code:

DockerClientConfiguration config = new();
using var client = config.CreateClient();

GetArchiveFromContainerParameters parameters = new()
{ 
	Path = "/root/eula.1028.txt"
};
var file = await client.Containers.GetArchiveFromContainerAsync("example", parameters, false);

using var memoryStream = new MemoryStream();
file.Stream.CopyTo(memoryStream);
file.Stream.Close();

memoryStream.Seek(0, SeekOrigin.Begin);

using var tarInput = new TarInputStream(memoryStream, Encoding.ASCII);
tarInput.GetNextEntry();

using var reader = new StreamReader(tarInput);

var content = reader.ReadToEnd();

Console.WriteLine(content);

I hope this helps!

Saturday, September 19, 2020

Burnout


image via Peakpx
 I recently listened to an interesting podcast about burnout that stimulated some thoughts regarding this silent killer that could easily get rampant, especially in the software industry which is known to be very mentally demanding.

This industry attracts very passionate persons who -given an interesting enough problem- will voluntarily give up a lot of their time, energy and other aspects of their social and health lives.

While seeking the satisfaction of solving complex problems or under tight delivery pressure, developers "get into the zone" and spend extended hours without even noticing.

Commonly, developers take pride in this aspect of their work. Other developers consider this as a role model for how a dedicated developer should be. Managers celebrate heroic efforts of their developers and even more take it for granted and it become a normal expectation.

But what's wrong with this? If the developer is really passionate about his/her work, so what?

One of the light bulb moments in this podcast is when Dr Aneika (PhD  in Organizational Behavior and Human Resources) said:

 "…you would think that some research or previous research said, well, maybe engagement is the antonym to burnout. But no, what we really found out is that people that are really, really engaged are the ones that are most susceptible to burnout"

"…to be a great developer, to be a great programmer, or to be a great coder, you have to really be involved. And that involvement that takes you in and sucks you in could be the same thing that can lead you down the road of burnout."

No surprise then that developers could go through waves of extreme productivity followed by low performance, if not conscious enough to how their mind and emotions work.

Another important aspect to consider especially if you're a leader in tech is the impact of your burnout on how you interact with those who you lead.

One component of burnout is depersonalization, that is when you're burnt out, you get detached from the surrounding team members, and focus only on what you get out of them. To you, they become more like functions with inputs and outputs, and your relationship becomes merely transactional, which is very dangerous.

To me, one of the most important leadership traits is empathy. When you're drained to the extent that you have no emotional capacity for empathy, you lose the ability to connect and support your team members. And especially if you're normally understanding and supportive, your fluctuating behaviour might hurt the trust you've earned.

Take care of the signs of burnout. And remember not to deplete all your energy before taking the time to recharge.

Saturday, January 4, 2020

Which language should I speak?

Working in a diverse environment with team members from many nationalities is a great experience. You get to know new cultures and recognize how similar people are across the world although the seemingly extreme differences.
In such an environment, you hear different languages all the time! And although there is usually a de facto business language, -English in my case, since I'm currently working in Australia-, some people prefer to have conversations in their native tongue with colleagues that share the same language even in a business context.

Well, is that OK?
There are many angles from which I see this matter.

It's good to feel natural

As a non-native English speaker myself, I feel very weird speaking with my Arabic speaking colleagues -especially Egyptians- in a secondary language, it just doesn't feel natural! Why speak in a language that we wouldn't normally use if we were having a casual chat? Put aside losing access to a huge stock of vocabulary and expressions that we share. This leads to the second point:

It's about effective communication

We need to get the job done, right? So why put a barrier in front of effective communication? Undoubtedly using my native language makes conveying my thoughts much easier. Besides, it gives better control over the tone of the conversation. I suppose the same goes for other nationalities as well.

But what are we missing?

Some people might feel excluded when others around them speak in a language they don't understand. However, I haven't seen this causing real issues.

A virtual wall?

I've been working in Agile teams for years. And I believe in the value of having collocated teams in facilitating communication. 
It happened many times that I overheard a discussion between other colleagues in my team area when I jumped in and gave help to solve an issue, guided on a topic, or threw in a piece of information that was necessary to solve a problem. Even if you're not intentionally paying attention, it's possible to save the team from consuming a lot of time going in circles.
Speaking in a different language defies the purpose of collocation and creates virtual walls. It's the same reason why some Agile practitioners recommend not putting headphones as they isolate the team member from the surrounding team interactions.

What about you? Do you prefer speaking in your first language if different from the common one used at work? On the other side, how do you feel about other colleagues speaking in a language that you don't understand?

Friday, April 26, 2019

Using Git hooks to alter commit messages

As developers we try to get the repetitive boring stuff out of our ways. Hence we try to use tools that automate some of our workflows, or if no tools is available for our specific needs, no problem, we automate them ourselves, we're developers after all!

In one of the projects I worked on, there was a convention to add the task id as part of each commit message because some tools are used to generate reports based on it. I'm not sure why this was required in that situation, but I had to follow the convention anyway. Since I tend to make many small commits every day, I was sure I'll forget to add the task id most of the time. So I started investigating Git hooks.

Git provides many hooks that could be used to automate some of the repetitive behaviors that are required to happen with the different life cycle steps of Git usage. For example:
    • Pre-commit
    • Pre-push
    • Prepate-commit-message
    • Commit-message

The folder ".git/hooks" within the git repository folder contains many sample commit hook files which are good starting points. The one of interest in this case was the commit-msg hook.

In my scenario, we had a convention to name our branches using the patterns "feature/" or "bug/".

So I decided to deduce the task id from the branch name and prepend it to the commit message.
I created a file with the name commit-msg in the .git/hooks folder, the code inside this file is similar to:

#!/bin/sh
message=$(cat $1)
branch=$(git branch | grep \* | cut -d ' ' -f2-)
task=$(echo $branch | cut -d / -f2-)
echo "$task - $message" > $1
  • Line 2: reads the original commit message from the temp file, whose name is passed as the first parameter to the script.
  • Line 3: reads the current branch name. Thanks to StackOverflow.
  • Line 4: extracts the task id from the branch name by splitting the string by the "/" character and taking the second part.
  • Line 5: overwrites the commit message with the required format.

Now when I commit code using:
git commit -m"test message"
And then inspect the logs using git log command, the commit message is modified as needed:
commit f1fe8918c754ca89649a2a86ef4ab0a9a53c0496 (HEAD -> feature/1234)
Author: Hesham A. Amin
Date:   Fri Apr 26 08:24:40 2019 +0200

    1234 - test message

commit 4e3e180d3a27772a32230bf6dbbd039b949dc30e
...

Investing few minutes to automate daunting repetitive tasks pays off on the long term.

Thursday, December 27, 2018

Removing the Server header from Kestrel hosted ASP.NET core apps

In the continuous battle of software builders against attackers, the less information the application discloses about its infrastructure the better.
One of the issues I've repetitively seen in penetration testing reports for web applications is the existence of the Server header, which as mentioned in MDN:

The Server header contains information about the software used by the origin server to handle the request.

Also as mentioned by MDN:

Overly long and detailed Server values should be avoided as they potentially reveal internal implementation details that might make it (slightly) easier for attackers to find and exploit known security holes.

By default, when using Kestrel web server to host an ASP.NET core application, Kestrel returns the Server header with the value Kestrel as shown in this screenshot from Postman:

Even though it doesn't sound like a big security risk, I just prefer to remove this header. This could be achieved by adding this line to the ConfigureServices method in the application Startup class:
services.PostConfigure(k => k.AddServerHeader = false);

The PostConfigure configurations run after all Configure methods. So it's a good place to override the default behavior.

Sunday, September 24, 2017

Azure Event Grid WebHooks - Retries (Part 3)

Building distributed systems is challenging. If not carefully designed and implemented, a failure in one component can cause cascading failures that affect the whole system. That's why patterns like Retry and Circuit Breaker should be considered to improve system resilience. In case of sending WebHooks the situation might be even worse as your system is calling a totally external system with no availability guarantees and over the internet which is less reliable than your internal network.
Continuing on the previous parts of this series (Part 1, Part 2) I'll show how to use Azure Event Grid to overcome this challenge.

Azure Event Grid Retry Policy

Azure Event Grid provides a built-in capability to retry failed requests with exponential backoff, which means that in case the WebHook request fails, it will be retried with increased delays.
As per the documentation failed requests will be retried after 10 seconds, and if the request fails again, it will keep retrying after 30 seconds, 1 minute, 5 minutes, 10 minutes, 30 minutes, and 1 hour. However these numbers aren't exact intervals as Azure Event Grid adds some randomization to these intervals.
Events that take more than 2 hours to be delivered will be expired. This duration should be increased to 24 hours after the preview phase.
This behavior is not trivial to implement which adds to the reasons why using a service like Azure Event Grid should be considered as an alternative to implementing it's capabilities from scratch.

Testing Azure Event Grid Retry

To try this capability and building on the example used in Part 1, I made a change to the AWS Lambda function that receives the WebHook to introduce random failures:

public object Handle(Event[] request)
{
    Event data = request[0];
    if(data.Data.validationCode!=null)
    {
        return new {validationResponse = data.Data.validationCode};
    }

    var random = new Random(Guid.NewGuid().GetHashCode());
    var value = random.Next(1 ,11);

    if(value > 5)
    {
        throw new Exception("Failure!");
    }

    return "";
}

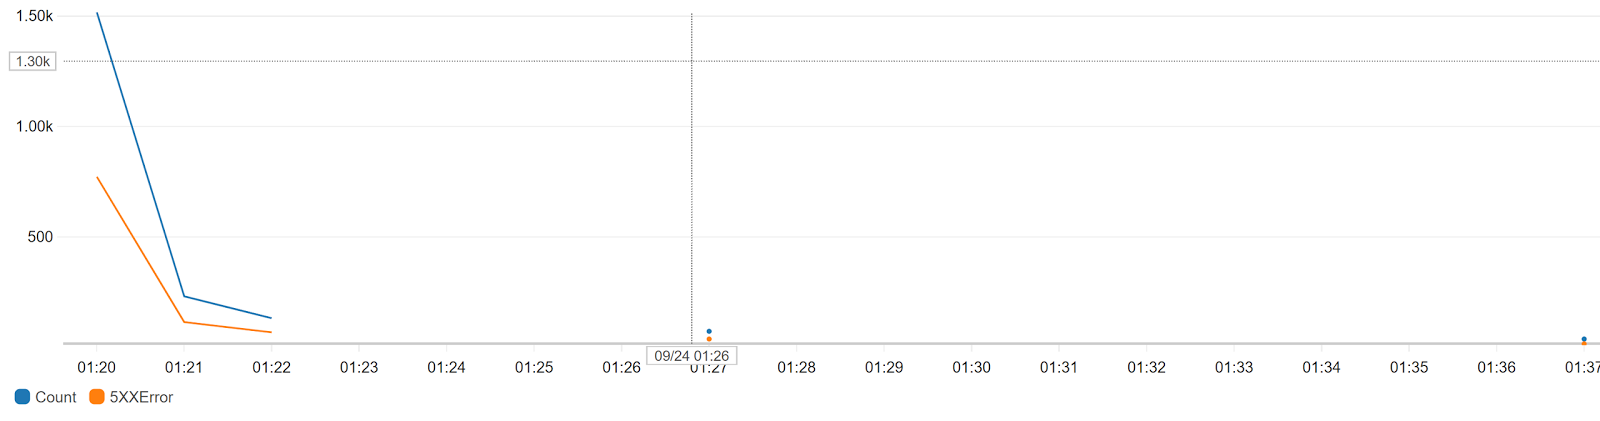
Lines 9-15 produce almost 50% failure rate. When I pushed an event (as shown in the previous posts) to a 1000 WebHook subscribers, the result was the below chart depicting the number of API calls per minute and number of 500 errors per minute:


Number of requests per minute (Blue) - Number of 500 Errors per minute (Orange)

We can observe the following:
  • The number of errors (orange) is almost half the number of requests (blue)
  • Number of requests  per minute is around 1500 for the first minute. My explanation is that since we have 1000 listeners and 50% failure rate, Azure has made extra 500 requests.
  • After a bit less than 2 hours (not shown in the chart for size constraints) the number of errors has dropped to 5 and no more requests were made. This is due to the expiration period during the preview.

Summary

Azure Event Grid is a scalable and resilient service that can be used in case of handling thousands (maybe more) of WebHook receivers. Whether your solution is hosted on premises or on Azure, you can use this service to offload a lot of work and effort.
I wish that Azure Event Grid could give some insights on how events are pushed and received which would help a lot in troubleshooting as the subscriber is usually not under your control. I hope this will become an integrated part of the Azure portal.
It's worth mentioning that other cloud providers support similar functionality as Event Grid that are worth checking, specifically Amazon Simple Notification Service (SNS) and Google Cloud Pub/Sub. Both have overlapping functionality with Azure Event Grid.

Sunday, August 27, 2017

Azure Event Grid WebHooks - Filtering (Part 2)

I my previous post I introduced Azure Event Grid. I demonstrated how simple it is to use Event Grid to push hundreds of events to subscribers using WebHooks.
In today's post I'll show a powerful capability of Event Grid which is filters.

What are Filters?

Subscribing to a topic means that all events pushed to this topic will be pushed to the subscriber. But what if the subscriber is interested only in a subset of the events? For example in my previous post I created a blog topic and all subscribers to this topic will receive notifications about new and updated blog posts, new comments, etc. But some subscribers might be interested only in posts and want to ignore comments. Instead of creating multiple topics for each type of event which will required separate subscriptions, Event Grid has the concept of filters. Filters are applied on the event content of and events will only be pushed to subscribers with matching filters.
The below diagram demonstrates this capability:

Filtering based on Subject prefix/suffix

Azure Event Grid supports two types of filters:
  • Subject prefix and suffix filters.
  • Event type filters.

Subject prefix and suffix filters

In this example I'll use a prefix filter to receive only events with subject starting with "post" using the --subject-begins-with post parameter.

az eventgrid topic event-subscription create --name postsreceiver --subject-begins-with post --endpoint https://twzm3c5ry2.execute-api.ap-southeast-2.amazonaws.com/prod/post -g rg --topic-name blog

Similarly:
az eventgrid topic event-subscription create --name commenstreceiver --subject-begins-with comment  --endpoint https://twzm3c5ry2.execute-api.ap-southeast-2.amazonaws.com/prod/comment -g rg --topic-name blog

An event that looks like:
[
    {
        "id": "2134",
        "eventType": "new",
        "subject": "comments",
        "eventTime": "2017-08-20T23:14:22+1000",
        "data":{
            "content": "Azure Event Grid",
            "postId": "123"
        }
    }
]

Will only be pushed to the second subscriber because it matches the filter.


Filtering based on event type

Another way for the subscriber to filter the pushed message is specifying event types. By default when a new subscription is added the subscriber filter data looks like
"filter": {                       
  "includedEventTypes": [         
    "All"                         
  ],                              
  "isSubjectCaseSensitive": null, 
  "subjectBeginsWith": "", 
  "subjectEndsWith": ""

The includedEventTypes attribute equals to "All" which means that the subscriber will get all events regardless the type.
You can filter on multiple event types as space separated values using the --included-event-types parameter:
az eventgrid topic event-subscription create --name newupdatedreceiver --included-event-types new updated --endpoint https://twzm3c5ry2.execute-api.ap-southeast-2.amazonaws.com/prod/newupdated -g rg --topic-name blog

which results in:
 "filter": {                     
   "includedEventTypes": [       
     "new",                      
     "updated"                   
   ],                            
   "isSubjectCaseSensitive": null,
   "subjectBeginsWith": "",      
   "subjectEndsWith": ""  

        
Which means that only events with type "new" or "updated" will be pushed to this subscriber. This event won't be pushed:
[
    {
        "id": "123456",
        "eventType": "deleted",
        "subject": "posts",
        "eventTime": "2017-08-20T23:14:22+1000",
        "data":{
            "postId": "123"
        }
    }
]

Summary

Enabling the subscriber to have control on which events it will receive based on subject prefix, suffix, or event type (and a mix of these options) is a powerful capability of Azure Event Grid. Routing events in a declarative way without writing any logic on the event source side significantly simplifies this scenario.

Tuesday, August 22, 2017

Azure Event Grid WebHooks (Part 1)

Few days ago, Microsoft announced the new Event Grid service. The service is described as:
"... a fully-managed intelligent event routing service that allows for uniform event consumption using a publish-subscribe model."
Although not directly related, I see this service as a complement to the serverless offerings provided by Microsoft after Azure Functions and Logic Apps.

Event Grid has many capabilities and scenarios. In brief , it's a service that is capable of listening to multiple event sources using topics and publishing them to subscribers or handlers that are interested in these  events.
Event sources can be Blob storage events, Event hub events, custom events, etc. And subscribers can be Azure functions, logic apps, WebHooks.
In this post I'll focus on pushing WebHooks in a scalable, reliable, pay as you go, and easy manner using Event Grid.

Topics, and WebHooks

Topics are a way to categorize events. A publisher defines topics and sends specific events to these topics. Publishers can subscribe to topics to listen and respond to events published by event sources.
The concept of WebHooks is not new. WebHooks are HTTP callbacks that respond to events that were originated in other systems. For example you can create HTTP endpoints that listen to WebHooks published by GitHub when code is pushed to a specific repository. This creates an almost endless number of integration possibilities.
In this post we'll simulate a blogging engine that pushes events when new posts are published. And we'll create a subscriber that listens to these events.

Creating a topic

The first step to publishing a custom event is to create a topic. As other Azure resources, Event Grid topics are created in resource groups. To create a new resource group named "rg" we can execute this command using Azure CLI v2.0.

az group create --name rg --location westus2
I Chose westus2 region because currently Event Grid has limited region availability. But this changes all the time.
The next step is to create a topic in the resource group. We'll name our topic "blog":
az eventgrid topic create --name blog -l westus2 -g rg

When you run the above command, the response should look like:

{                                                                                                    
  "endpoint": "https://blog.westus2-1.eventgrid.azure.net/api/events",                                                     
  "id": "/subscriptions/5f1ef4e8-6358-4a75-b171-58904114fb57/resourceGroups/rg/providers/Microsoft.EventGrid/topics/blog", 
  "location": "westus2",                                                                                                    
  "name": "blog2",                                                                                                          
  "provisioningState": "Succeeded",                                                                                         
  "resourceGroup": "rg",                                                                                                    
  "tags": null,                                                                                                             
  "type": "Microsoft.EventGrid/topics"                                                                                      
}
Observe the endpoint attribute. Now we have the URL to be used to to push events: https://blog.westus2-1.eventgrid.azure.net/api/events.


Subscribing to a topic

To show the capabilities of the Event Grid, I need to create hundreds of subscribers. You can create your subscribers in any HTTP capable framework. I chose to use AWS Lambda functions + API Gateway hosted in Sydney region. This proves that there is no Azure magic by any means. Just pure HTTP WebHooks sent from Azures data centers in west US to AWS data centers in Sydney.
The details of creating Lambda functions and exposing them using API Gateway aren't relevant to this post, the important thing is to understand that I have an endpoint that listens to HTTP requests on: https://twzm3c5ry2.execute-api.ap-southeast-2.amazonaws.com/prod/{id} and forwards them to AWS Lambda implemented in C#.
The command to create a subscription looks like:

az eventgrid topic event-subscription create --name blogreceiver   --endpoint https://twzm3c5ry2.execute-api.ap-southeast-2.amazonaws.com/prod/   -g rg  --topic-name blog 

I created 100 subscriptions using this simple Powershell script:

while($val -ne 100) { $val++ ;  az eventgrid topic event-subscription create --name blogreceiver$val   --endpoint https://twzm3c5ry2.execute-api.ap-southeast-2.amazonaws.com/prod/$val   -g rg  --topic-name blog}

An important thing to notice which is the security implications of this model. If I was able to specify any URL as a subscriber to my topic, I'd be able to use Azure Event Grid as a DDoS attacking tool. That's why subscription verification is very important.

Subscription verification

To verify that the subscription endpoint is a real URL and is really willing to subscribe to the topic, a verification request is sent to the subscription endpoint when the subscription is created. This request looks like:

[
{
    "Id": "dbb80f11-6fbb-4fc3-9c1f-034f00da3b5f",
    "Topic": "/subscriptions/5f1ef4e8-6358-4a75-b171-58904114fb57/resourceGroups/rg/providers/microsoft.eventgrid/topics/blog",
    "Subject": "",
    "Data": {
        "validationCode": "4fc3f59c-2d03-41f4-b466-da65a81f8ba5"
    },
    "EventType": "Microsoft.EventGrid/SubscriptionValidationEvent",
    "EventTime": "2017-08-20T11:11:00.0101361Z"
}
]

The validationCode attribute has a unique key to identify the subscription request. The endpoint should respond to the verification request with the same code:

{"validationResponse":"3158cb2f-a2c4-46ca-96b0-ae2c8562fa43"}

The subscriber

The subscriber is very simple. It checks whether the request has a validation code. If so, it responds with the validation response. Otherwise it just returns 200 or 202.


    public class Event
    {
        public Data Data { get; set; }
    }
    public class Data
    {
        public string validationCode { get; set; }
    }

    public class Receiver
    {
        public object Handle(Event[] request)
        {
            Event data = request[0];
            if(data.Data.validationCode!=null)
            {
                return new {validationResponse = data.Data.validationCode};
            }
            return "";
        }
    }

Note that the AWS API Gateway is responsible for setting the status code to 200.


Pushing events

As I showed above, I created 100 subscribers. Now it's time to start pushing events which is a simple post request but of course this request must be authenticated. The authentication methods supported are Shared Access Signature "SAS" and keys. I'll use the latter for simplicity.
To retrieve the key, you can use the management portal or this command:

az eventgrid topic key list --name blog --resource-group rg
To configure my .net core console application that will push the events, I created 2 environment variables using Powershell:
$env:EventGrid:EndPoint = "https://blog.westus2-1.eventgrid.azure.net/api/events"
$env:EventGrid:Key = "HQI2Ff7MoqlV8RFc/U........."
I created a class to read the configuration variables into an instance of it:

class EventGridConfig
{
    public string EndPoint { get; set; }
    public string Key { get; set; }
}
The rest is simple. Reading the configuration variables, and posting an event to the endpoint.

Configuration = builder.Build();
var config = new EventGridConfig();
Configuration.GetSection("EventGrid").Bind(config);

var http = new HttpClient();
string content = @"
    [
        {
            ""id"": ""123"",
            ""eventType"": ""NewPost"",
            ""subject"": ""blog/posts"",
            ""eventTime"": ""2017-08-20T23:14:22+1000"",
            ""data"":{
                ""title"": ""Azure Event Grid"",
                ""author"": ""Hesham A. Amin""
            }
        }
    ]";

http.DefaultRequestHeaders.Add("aeg-sas-key", config.Key);
var result = http.PostAsync(config.EndPoint, new StringContent(content)).Result;
Now it's Azure's Event Grid turn to push this event to the 100 subscribers.

The result

Running the above console application sends a request to Azure Event Hub. In turn in sends the event to the 100 subscribers I've created.
To see the result. I use AWS API Gateway CloudWatch graphs which show the number of requests to my endpoint. I ran the application few times and the result was this graph:
Requests per minute


Summary

In this post I've shown how to use Azure Event Grid to push WebHooks to HTTP endpoints and how to subscribe to these WebHooks.
In next posts I'll explore more capabilities of Azure Event Grid.